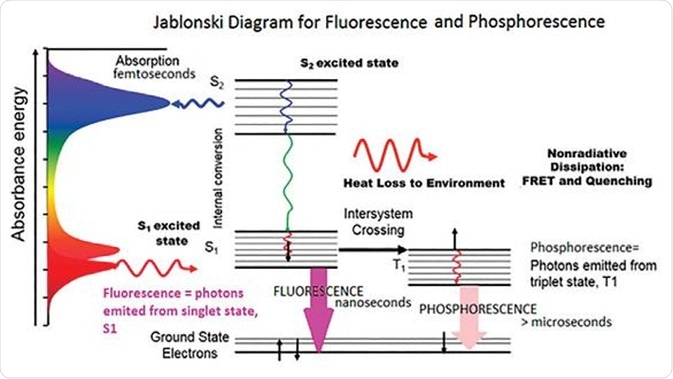
The optical emissions of chemical compounds can be studied by the use of photoluminescence spectroscopy. The term ‘photoluminescence’ encompasses phosphorescence and fluorescence spectroscopy. Fluorescence occurs when the molecule of interest is excited to its singlet excited state and intersystem crossing does not take place.

Image Credit: Horiba
In the conventional fluorescence emission spectroscopy, the photoexcitation wavelength is kept constant, whilst the photoemission wavelength is scanned generating the emission spectrum. Conversely, when the excitation wavelength is varied, while the target emission wavelength is held constant the excitation spectrum is formed. For the vast majority of compounds, their fluorescence spectra contain featureless spectral bands which can be quite broad.
Variants of the technique
In an attempt to obtain spectra with narrower bands that could give precise information about the constituents of a solution, synchronous fluorescence spectroscopy (SFS) was created. The idea behind this new method was to scan both the excitation and the emission wavelength at a constant difference while monitoring the emission signal. SFS is currently used for the quantification of compounds in complex solutions.
Overtime SFS has been diversified to constant wavelength SFS, constant-energy SFS, variable angle SFS and matrix isopotential SFS. Each variant can be used in unique ways and can shed light on different areas of scientific interest.
For example, polycyclic aromatic hydrocarbons can be discriminated by variable angle SFS, and Raman scatter interference can be reduced by the use of constant-energy synchronous fluorescence. Additionally, urine samples can be analyzed by employing the matrix isopotential SFS.
Applications of the technique
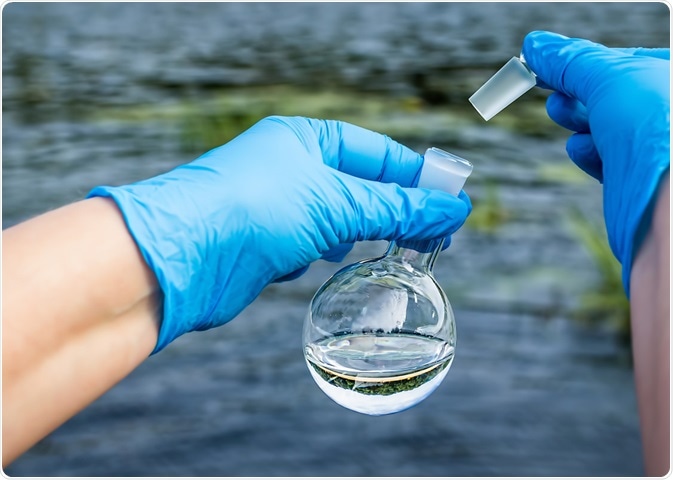
There is an urgent need for a rapid and effective method that can provide a correct evaluation of water quality. Fluorescence spectroscopy has been proven to be helpful in that regard. Research has shown that wastewater has a greater fluorescence intensity compared to natural water due to the abundance of living and dead cellular material and microbial reprocessed organic matter.
Therefore, a simple fluorometer with suitable selectivity (in terms of wavelength) can be very effective and cost-efficient. Another interesting application of fluorescence spectroscopy is in biopsies. Specifically, the grade of liver fibrosis can be estimated by using fluorescence spectroscopy. It was proved that when used at the correct wavelength (450nm excitation wavelength), it can work as a complementary tool to assess hepatic fibrosis in human liver samples.
Another interesting application is the monitoring of chemical reactions. A change in luminescence accompanies many chemical reactions. This phenomenon can be exploited to determine the reaction products and to define the major kinetic characteristics. Water is used as the ‘’probe molecule’’ in mechanistic studies, due to having no optical emission.
When the fluorescence of the solid of interest is altered during the reaction, then solid-state SFS can assist in locating the active sites. This strategy has been followed successfully when analyzing a wide range of nano-powders used for pigments or refractory ceramics.

Image Credit: Mr_Mrs_Marcha/Shutterstock.com
Further uses and future potential
Conventional fluorescence spectra of organic compounds such as proteins or DNA gives off a low signal intensity. To overcome that, adsorbed proteins and amino acids on metallic nanostructures were introduced. By using gold, aluminum, or silver as the metals the signal intensities were improved, making the study of DNA and protein fluorescence feasible.
Forensic analysis of artworks can take advantage of a non-destructive technique (artwork has to be preserved), with high sensitivity such as fluorescence spectroscopy. Solid-state SFS can determine the energy of absorption and emission of light in a chosen substance. This property can aid in establishing the authenticity of sculptures or other works of art.
Another emerging application of Fluorescence spectroscopy is its use to assess the level of contamination of a certain surface. A light source such as UV or laser is aimed at a surface of interest. The radiation produced by the surface is then detected and compared to a standard surface that has been cleaned to the desired level. A contamination map can be easily created by focusing the measuring head (manually or automatically) of the device on several locations within the surface of interest.
Additionally, the same idea can be utilized to assess the exposure of human skin to unwanted contaminants, which is vital in a health care institution or industrial work context. Even single-molecule vibrational imaging is possible with the latest Raman-mediated fluorescence method.
Concluding remarks
Fluorescence spectroscopy, and mostly its major improved variants described earlier have found a wide range of applications in the recent decade in analyzing samples of natural or synthetic origin, qualitatively and quantitatively. Their major advantages are their simplicity of use, their non-destructive nature (with regards to the sample of interest), and lastly, their improved spectral resolution compared to the resolution of ‘’conventional’’ fluorescence spectroscopy.
Despite the major recent advancements, the full potential of the aforementioned techniques stills remains to be explored.
References
- Rajiv Kohli, K.L. Mittal, Methods for Assessing Surface Cleanliness, In Developments in Surface Contamination and Cleaning, 12 pp. 23-105
- Alexander Samokhvalov, Analysis of various solid samples by synchronous fluorescence spectroscopy and related methods: A review Talanta 216
- Elfrida M. Carstea , John Bridgeman, Andy Baker, Darren M. Reynolds, Fluorescence spectroscopy for wastewater monitoring: A review, Water Research 95 pp. 205-19
Further Reading
Last Updated: Nov 23, 2020