Basic Principles
Generally, UV-Vis Spectroscopy is used to determine the concentrations of elements in a solution. To achieve that, UV-Vis Spectroscopy relies on the Beer-Lambert Law (A = a b c), which implies that when the concentration of the component of interest is zero (c=0), then absorbance will be also zero, along with a small value for the intercept (b).

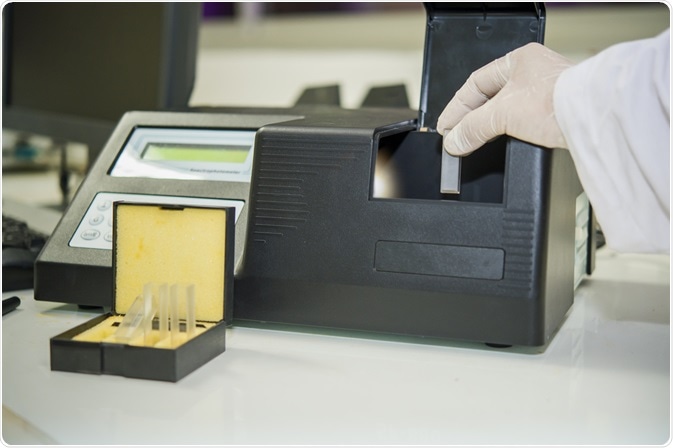
Image Credit: Rabbitmindphoto/Shutterstock.com
The absorbance of a solution is cumulative; the aggregate absorption of light at a certain wavelength is equal to the sum of the absorbance the two compounds of interest (assuming a binary mixture) would have if they were measured separately. Lastly, a reference (blank) sample is used for each measurement. The measured absorbance is the difference between the absorbance of the solution of the sample of interest and the absorbance of the reference sample.
Overlapping Spectra
Multi-component mixtures often display overlapping spectra. When the overlapping is extensive certain spectroscopic techniques can be used for the simplification of partially or severely overlapped spectra.
Spectrum Subtraction: This method relies on the property of absorption spectroscopy which was explained earlier; the total absorption of light at a given wavelength equals the sum of the absorbance which the two substances would display when measured individually. This method can also be used to supplement other methods.
The area under curve correction method (AUC-CM): A well-known spectrophotometric manipulation method that can determine simply the component of interest-based on the area of its absorption spectra. When dealing with a binary mixture that is partially overlapped, the first step is to calculate the AUC at a wavelength range where the peaks do not overlap, and subsequently, this value can be used in the AUC factor to find out the corrected area (the overlapping area) under the curve.
Induced dual-wavelength method (IDW): Another method that can be applied for a binary mixture of X and Y where overlapping is extensive. It can be applied on zero-order spectra, at two wavelengths where the absorbance of the interfering compounds is not equal. The effect of Y at the two wavelengths can be canceled out by calculating the equality factor of pure Y, and then the difference in absorbance is directly proportional to the concentration of component X.
Generally, many other spectra manipulation techniques exist. The most frequently encountered are methods based on the area under the curve, methods applied on derivative spectra, and methods applied on the ratio spectra (one analyte is standardized as a divisor).
Applications of UV-Vis Spectroscopy
With UV/Vis spectroscopy being very simple to use and cost-efficient technique, it is no surprise that it is being employed for many different tasks. One wide-spread application is its use as a characterization method of polymer nano-composites, to study their optical properties.
By using UV/Vis spectroscopy in tandem with other characterization techniques an evaluation regarding the ideal optical properties of nanofillers in a polymer matrix can be obtained. Based on the information obtained, the desired optical properties can be achieved by changing or adjusting the type or composition of the nanofiller.
Additionally, this technique is applied for the determination of aromatic compounds and/or to a wide range of UV-absorbing compounds that can be used for making painted coatings and fabric more durable or to protect the human skin. When used in combination with liquid chromatography, it can aid in detecting and quantifying compounds that are separated from complex mixtures, where other techniques would have destroyed them. The mixtures can vary from foods, dyes to steroids, and flavoring agents.
Moreover, UV-Vis spectroscopy has found use in the study of Electroactive Biofilm. Specifically, by studying how certain microorganisms have evolved to transport electrons over biological membranes to or from their extracellular environment. This property can be exploited for energy or bioproduct recovery or wastewater treatment. The use of UV-Vis spectroscopy in this instance can shed some light on the intricate mechanisms of these microorganisms by interacting with their functional groups (chromophores) which contain valence electrons of low excitation energy that can absorb both visible and ultra-violet light.
Furthermore, UV-Vis spectroscopy is used for pharmaceutical applications. UV spectrophotometric methods are ideal for multi-component formulations or samples of complex matrices due to its ease of use and cost-effectiveness, as mentioned earlier. However, for this type of analysis classical UV spectral measurements cannot be used since the analytes of interest would be absorbing on the same spectral areas. Therefore, this obstacle is tackled by employing derivatives spectroscopy or simultaneous spectroscopy along with using equimolar solutions and ratio derivative spectroscopy in an attempt to increase selectivity and specificity.
Last but not least, in comparison with other advanced techniques (such as chromatography) UV-Vis spectroscopy can offer less troubleshooting time, fewer interferences, and more robust results.
References
- Dipali M Atole, Hrishshikesh Rajput, Ultraviolet spectroscopy and its pharmaceutical applications- A brief review, Asian Journal of Pharmaceutical and Clinical Research 11(2):59,2018
- Adnan Mujahid, Franz L. Dickert, in Molecularly Imprinted Sensors, 2012
- M.B. Eyring, P. Martin, in Reference Module in Chemistry, Molecular Sciences and Chemical Engineering, 2013
- S. Pentassuglia et al., EAB—Electroactive Biofilm: A Biotechnological Resource, in Encyclopedia of Interfacial Chemistry, 2018
Further Reading
Last Updated: Jan 28, 2021