Cannabis - like every plant and botanical found in nature - contains terpenes. These aromatic oils are responsible for the distinctive smells and flavors associated with different varieties of cannabis.
Up to 140 different types of terpenes have been reported in cannabis, but a number of recent studies have revealed that approximately 17 of these most commonly present terpenes can be employed in the analysis of chemotypes, for example, those strains that have different chemical properties from one another.1
Monoterpenes, diterpenes and sesquiterpenes can be characterized by investigating the number of repeating units of isoprene - a five-carbon molecule that is the structural hallmark of all terpenoid compounds.
The most interesting characteristic of this impressive and diverse palate of cannabis terpenes is their ability to interact synergistically with other compounds present in the plant, including cannabinoids.
Substantial research has been undertaken over recent decades as scientists seek to better understand the synergistic interaction between terpenes and cannabinoids in the human body known as the ‘entourage effect.’
It is believed that this effect amplifies the therapeutic benefits of the plant’s individual components, meaning that the whole plant’s medicinal impact is greater than the sum of its parts.
The ability to detect and quantify terpenes is, therefore, a key factor in understanding the unique medical and recreational effects of cannabis.
This article details a turnkey solution for the analysis of terpenes in cannabis samples – a combination of pressure-balanced headspace (HS) sample introduction and gas chromatography-mass spectrometry (GC/MS).
It also explores and evaluates a range of instrumental parameters and method optimization techniques designed to facilitate the highest possible sample throughput.
The Headspace Sample Introduction Technique
Utilizing headspace via pressure-balanced injection is a rapid, straightforward, accurate and precise solution.
This solution also allows the components of interest (for example, residual solvents and terpenes) to be introduced into the analytical system.
Non-volatile matrix components are kept in the sample vial, and because these do not enter the GC this method offers rapid analysis and an almost maintenance-free system.2
This technique is also widely recognized and has been established as a suitable quantitation method in several highly regulated industries, including pharmaceutical (FDA), forensics and environmental applications.3,4,5
It is also routinely used for the characterization of fragrances and flavors in several matrices.6
Instrumentation
The examples presented here were investigated using the TurboMatrix™ HS sampler and a Clarus® SQ 8 GC/MS (PerkinElmer Inc., Shelton, CT).
MS detection was selected to enable targeted compounds to be identified by their spectra while also ensuring that it is possible to identify any unknown components present in the sample but not included in the standard, provided these are included in the mass spectral library being utilized.
Human taste thresholds are extremely sensitive, meaning that a flavor may be present at very low levels while still being highly potent. This sensitivity necessitates the use of high sensitivity of MS detection rather than a flame ionization detector.
The use of this turnkey solution in the identification and quantification of terpene and other flavor components offers faster analysis, improved productivity, more streamlined product release and maximum system uptime – all vital factors in high throughput cannabis testing labs.
Experimental
Rapid chromatography was accomplished by using a commercially available 42 terpene standard (CAN-TERP-MIX1H and CAN-TERP-MIX2H, SPEX CertiPrep®, Metuchen, NJ) at 1000 µg/mL stock solution.
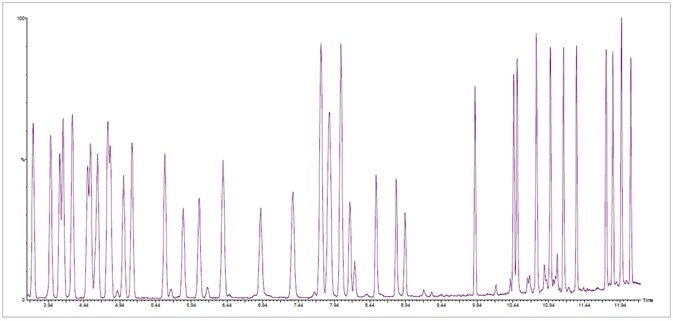
Figure 1. Fast total ion chromatogram (TIC) at standard concentration of 20 ppm of 42 terpenes in less than 12.5 minutes. Image Credit: PerkinElmer Cannabis & Hemp Testing Solutions
The rapid chromatogram at 20 ppm of both MIX 1 and MIX 2 is presented in Figure 1. This was completed in under 12.5 minutes.
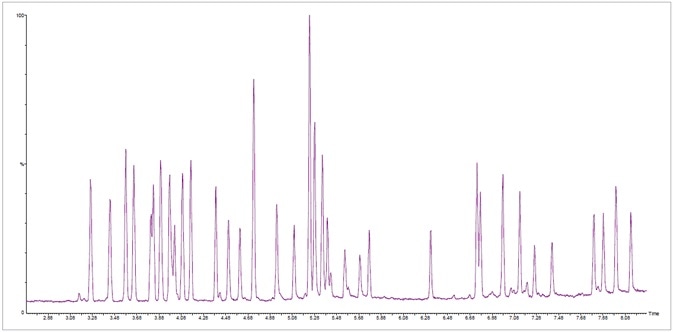
Figure 2. Fast total ion chromatogram (TIC) of a standard mixture of 42 terpenes from SPEX CertiPrep® in less than 8.5 minutes at a concentration of 20 ppm. Image Credit: PerkinElmer Cannabis & Hemp Testing Solutions
It is also possible to achieve a faster time of under 8.5 minutes (Figure) - the key difference between these two chromatograms is the presence of co-elution with an uncommon terpene.
Where samples’ terpene concentrations surpassed the 500 ppm calibration via the SPEX CertiPrep® stock standard solution, analysis was completed via the fast 8.5-minute method using a higher concentration commercially available standard (Restek® Corporation, Bellefonte, PA - Catalog Number 34095) (Figure 3).
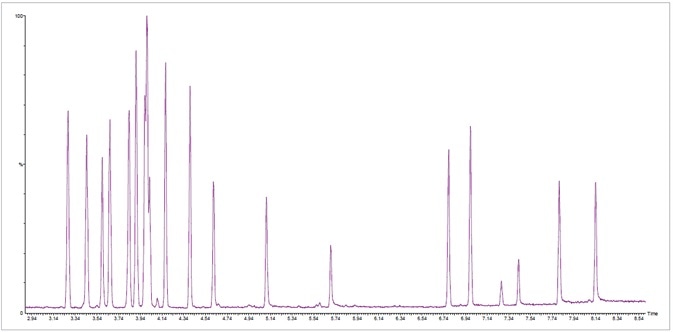
Figure 3. Fast total ion chromatogram (TIC) at standard concentration of 20 ppm of 42 terpenes in less than 8.5 minutes. Image Credit: PerkinElmer Cannabis & Hemp Testing Solutions
Validation
A number of experiments were performed to validate analytical performance and the method itself. These included dynamic range (linearity) and precision (repeatability).
A cannabidiol (CBD) oil was also spiked with a known standard concentration in order to evaluate compound matrix recoveries from a genuine sample, while proficiency test (PT)7 samples were evaluated to ensure inter-laboratory reproducibility.
Method accuracy was confirmed in both the matrix spike and the PT results.
Calibration
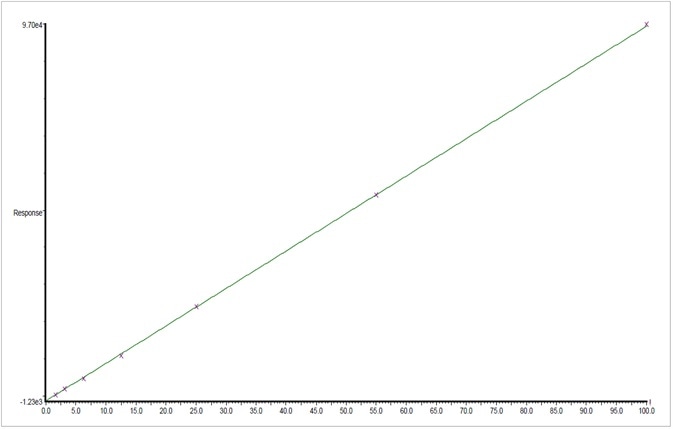
Figure 4. Graphical representation of the calibration for linalool from 1.9 to 500 ppm. Image Credit: PerkinElmer Cannabis & Hemp Testing Solutions
The SPEX CertiPrep® standard was used to generate a 7-point calibration standard of 1.9 to 500 ppm for every terpene being analyzed. Figure 4 shows an example of the first order calibration plot of the naturally occurring terpene Linalool.
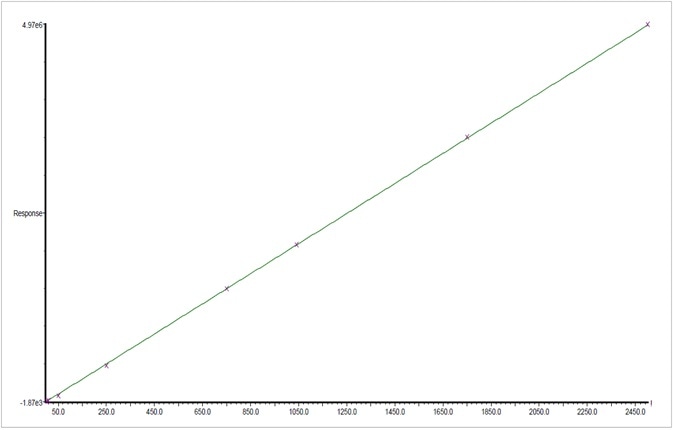
Figure 5. Calibration plot for β-myrcene from 2.5 to 2500 ppm. Image Credit: PerkinElmer Cannabis & Hemp Testing Solutions
A 7-point calibration range of 2.5 to 2500 ppm was also generated using the Restek® standard. Figure 5 shows an example of the first order calibration plot of ß-myrcene.
It is important to note that if required, lower detection limits of terpenes can also be achieved via this method.
Repeatability
Repeatability (precision) was ascertained by employing both a 20 ppm SPEX CertiPrep® standard and a 50 ppm Restek® standard. A total of 20 µL was inserted into eight separate headspace vials prior to these being consecutively analyzed.
Spike Recovery
In order to test for recoveries, the SPEX CertiPrep® standard was used to spike a cannabidiol (CBD) oil at a concentration of 125 ppm with 20 µL of sample inserted into a headspace vial and analyzed.
Results
Correlation coefficients (R2) for both standards were used to determine results for calibration.
Table 1. The results for dynamic range (linearity), precision and recovery testing protocol. Source: PerkinElmer Cannabis & Hemp Testing Solutions
| Standard |
SPEX CertiPrep Standard |
Restek Standard |
Matrix Spike |
| Compound |
Calibration
1.9 to 500 ppm |
Precision @
20 ppm (n=8) |
Calibration
2.5 to 2500 ppm |
Precision @
50 ppm (n=8) |
% Recovery |
| α-Pinene |
0.9997 |
1.99 |
0.9997 |
2.24 |
95.6% |
| Camphene |
0.9998 |
1.60 |
0.9996 |
3.10 |
96.9% |
| β-Myrcene |
0.9999 |
1.57 |
0.9998 |
1.87 |
99.8% |
| Sabinene |
0.9999 |
1.57 |
np* |
np |
86.4% |
| β-Pinene |
0.9998 |
1.98 |
0.9995 |
1.19 |
99.9% |
| α-Phellandrene |
0.9997 |
1.77 |
np |
np |
92.1% |
| 3-Carene |
0.9999 |
0.98 |
0.9998 |
2.78 |
96.0% |
| α-Terpinene |
0.9999 |
1.21 |
0.9990 |
2.48 |
102.9% |
| Limonene |
0.9997 |
1.88 |
0.9994 |
1.49 |
92.6% |
| p-Cymene |
np |
np |
0.9992 |
1.98 |
np |
| Ocimene (Isomers) |
0.9995 |
2.47 |
0.9992 |
2.96 |
84.4% |
| Eucalyptol |
0.9999 |
0.79 |
np |
np |
99.4% |
| γ-Terpinene |
0.9998 |
1.10 |
0.9995 |
2.40 |
96.9% |
| Terpinolene |
0.9997 |
1.89 |
0.9978 |
2.11 |
101.0% |
| Sabinene Hydrate |
0.9996 |
2.10 |
np |
np |
88.6% |
| Linalool |
0.9999 |
0.98 |
0.9982 |
2.67 |
88.8% |
| Fenchone (Isomers) |
0.9996 |
1.55 |
0.9997 |
2.41 |
101.0% |
| Fenchol |
0.9995 |
2.40 |
0.9992 |
3.19 |
89.3% |
| Isopulegol |
0.9999 |
1.99 |
0.9995 |
2.50 |
107.0% |
| Camphor (Isomers) |
0.9997 |
1.50 |
np |
np |
98.7% |
| Isoborneol |
0.9996 |
1.70 |
np |
np |
99.2% |
| Hexahydrothymol (Menthol) |
0.9996 |
1.70 |
np |
np |
101.3% |
| Borneol (+) and (-) |
0.9996 |
1.99 |
np |
np |
99.0% |
| α-Terpineol |
0.9991 |
2.87 |
np |
np |
84.9% |
| γ-Terpineol |
0.9990 |
2.99 |
np |
np |
92.1% |
| Nerol |
0.9999 |
1.50 |
np |
np |
106.3% |
| Geraniol |
0.9997 |
1.61 |
0.9999 |
1.95 |
103.0% |
| Pulegone |
0.9996 |
1.55 |
np |
np |
98.7% |
| Geranyl acetate |
0.9995 |
1.43 |
np |
np |
112.0% |
| α-Cedrene |
0.9999 |
1.11 |
np |
np |
95.1% |
| trans-β-Caryophyllene |
0.9998 |
1.85 |
0.9997 |
2.95 |
97.7% |
| Farnesene (Isomers) |
0.9995** |
3.56 |
np |
np |
101.1% |
| α-Humulene |
0.9997 |
2.85 |
0.9990 |
3.22 |
97.7% |
| Valencene |
0.9999 |
2.10 |
np |
np |
100.3% |
| cis-Nerolidol |
0.9990 |
3.10 |
0.9990 |
4.50 |
100.4% |
| trans-Nerolidol |
0.9991 |
2.99 |
0.9993 |
4.35 |
97.3% |
| Guaiol |
0.9999 |
2.77 |
0.9990 |
3.79 |
99.1% |
| Caryophyllene Oxide |
0.9991 |
3.60 |
np |
np |
106.5% |
| Cedrol |
0.9990 |
3.89 |
np |
np |
106.1% |
| α-Bisabolol |
0.9990 |
3.85 |
0.9976 |
4.06 |
98.3% |
*Component not present in this commercial stock standard
** Data from one isomer
Table 1 shows the results for the dynamic range, matrix spike recoveries and precision testing protocol. This data successfully validates the terpene turnkey solution employed using the 12.5-minute methodology.
Table 2. Terpene results from an extracted flower courtesy of Cassandra (Cassie) Ereman. Source: PerkinElmer Cannabis & Hemp Testing Solutions
| Terpene Profile |
| Compound |
μg/g |
% |
Compound |
μg/g |
% |
| α-Pinene |
1327.33 |
0.133 |
Isopulegol |
nd |
0.000 |
| Camphene |
125.78 |
0.013 |
Camphor |
nd |
0.000 |
| Sabinene |
80.96 |
0.008 |
Isoborneol |
nd |
0.000 |
| β-Myrcene |
3997.07 |
0.400 |
Borneol |
78.67 |
0.008 |
| β-Pinene |
1711.53 |
0.171 |
Terpineol |
1030.94 |
0.103 |
| α-Phellandrene |
665.95 |
0.067 |
γ-Terpineol |
nd |
0.000 |
| 3-Carene |
481.17 |
0.048 |
Nerol |
nd |
0.000 |
| α-Terpinene |
252.93 |
0.025 |
Geraniol |
nd |
0.000 |
| trans-β-Ocimene |
nd* |
0.000 |
(+)-Pulegone |
nd |
0.000 |
| Limonene |
4496.99 |
0.450 |
Geranyl acetate |
nd |
0.000 |
| p-Cymene |
nd |
0.000 |
a-Cedrene |
nd |
0.000 |
| cis-β-Ocimene |
nd |
0.000 |
trans-β-Caryophyllene |
2882.43 |
0.288 |
| Eucalyptol |
nd |
0.000 |
α-Humulene |
1014.02 |
0.101 |
| γ-Terpinene |
309.19 |
0.031 |
Valencene |
nd |
0.000 |
| Terpinolene |
9445.88 |
0.945 |
cis-Nerolidol |
nd |
0.000 |
| Sabinene Hydrate |
nd |
0.000 |
trans-Nerolidol |
nd |
0.000 |
| Linalool |
733.19 |
0.073 |
Guaiol |
nd |
0.000 |
| allo-Ocimene |
nd |
0.000 |
Caryophyllene oxide |
nd |
0.000 |
| Fenchone |
50.77 |
0.005 |
Cedrol |
nd |
0.000 |
| Fenchol |
474.76 |
0.047 |
α-Bisabolol |
nd |
0.000 |
| Total |
|
|
|
29159.57 |
2.916 |
*not detected compound in this sample
Table 2 provides data on terpenes found in an extracted flower. This analysis was completed on the TurboMatrix HS sampler and a Clarus SQ 8 GC/MS by Cassandra (Cassie) Ereman from Juniper Analytics, Bend, Oregon.
Figure 6 features a chart that displays this extract’s terpene profile.
Figure 6. Terpene profile of the results from an extracted flower. Image Credit: PerkinElmer Cannabis & Hemp Testing Solutions
Discussion of Results
This study’s goal was centered around the creation of a robust, linear, accurate and precise method suitable for determining concentrations of terpenes in cannabis and cannabis products. This goal has clearly been achieved.
The Clarus 690 GC offers rapid cooling and returning samples to their initial temperature took just 1.6 minutes, meaning that the total sample throughput of 10.5 or 14.0 minutes, depending on which of the two methods is employed.
The correlation coefficient for every compound is equal to or better than 0.999. Most of these are better than 0.9996, demonstrating the method’s excellent linearity.
Spike recovery and precision values are better than those defined by regulatory requirements.
Conclusion
The results presented here indicate that PerkinElmer’s HS-GC/MS solution for the determination of terpenes is robust and rapid. This solution offers laboratories enhanced sample throughput, maximum instrument uptime, a virtually maintenance-free system and improved profits.
As this method is a turnkey solution, the system includes all required acquisition and processing methods and standard operating procedures (SOP).
A turnkey solution for residual solvents in cannabis concentrates using headspace (HS) sampling coupled with GC/MS is also available.8
References
- Development and Validation of a Reliable and Robust Method for the Analysis of Cannabinoids and Terpenes in Cannabis. Giese M. W, Lewis M.A, Giese L, Smith K.M, Journal of AOAC International Vol. 98, No. 6, pp 1503-1522, 2015.
- An Introduction to Headspace Sampling Gas Chromatography Fundamentals and Theory: Andrew Tippler, PerkinElmer, Inc. Application Note.
- Residual Solvents in Pharmaceuticals by USP Chapter <467> Methodology, David Scott, PerkinElmer, Inc. Application Note.
- Increasing Accuracy of Blood-Alcohol Analysis Using Automated Headspace-Gas Chromatography, John Musselman, Anil Solanky, William Arnold, PerkinElmer, Inc. Application Note.
- Measuring Environmental Volatile Organic Compounds Using US EPA Method 8260B with headspace trap GC/MS, Heidi Griffith, PerkinElmer, Inc. Application Note.
- Monitoring Volatile Organic Compounds in Beer Production Using the Clarus SQ 8 GC/MS and TurboMatrix Headspace Trap Systems, Lee Marotta, Andrew Tipler, PerkinElmer, Inc. Application Note.
- The Emerald Test: Inter-laboratory Comparison and Proficiency Test for Cannabis Testing Labs.
- High Throughput Testing of Residual Solvents in Cannabis Concentrates Using Headspace (HS) Sampling Coupled with Gas Chromatography/Mass Spectrometry (GC/MS), Lee Marotta, Tom Kwoka, David Scott, Miles Snow, Toby Astill, PerkinElmer, Inc. Application Note.
Acknowledgments
Produced from materials originally authored by Lee Marotta, David Scott, Adam Floyd and Toby Astill from PerkinElmer; and Cassandra (Cassie) Ereman and Ben Armstrong from Juniper Analytics.
About PerkinElmer Cannabis & Hemp Testing Solutions
 With the cannabis and hemp markets continuing to grow rapidly and regulations strengthening, labs increasingly need streamlined access to best-in-class testing solutions geared toward the unique requirements of the industry. Whether your lab is well established or just starting up, PerkinElmer is a single-source vendor for instruments, methods, reagents, and consumables on hand to help enhance your testing capacity and get ahead of the competition.
They help drive analytical best practices and operating procedures and commit to ensuring your laboratory has maximum uptime. Learn about their various instruments, testing methods, and applications for cannabis analyses. Let them work with you to build an efficient workflow, so you can focus on growing your business.
Sponsored Content Policy: AZO Life Science publishes articles and related content that may be derived from sources where we have existing commercial relationships, provided such content adds value to the core editorial ethos of AZO Life Science, which is to educate and inform site visitors interested in medical research, science, medical devices, and treatments.