Produced in Partnership with PerkinElmerReviewed by Olivia FrostSep 7 2022
In this interview, PerkinElmer, talks to AZoLifeSciences about overcoming challenges associated with analyzing pesticides.
Could you tell us about the analysis of all of the pesticides regulated by California in cannabis-related medicines? How was the method created?
When we were developing this method, we faced a number of challenges. Most LC/M S/MS systems have only an electrospray ion source. Therefore, it was assumed that all 66 pesticides on the California list could not be analyzed with LC/MS/MS systems since the electrospray ion source cannot ionize some of the pesticides on Californian lists, such as pentachloronitrobenzene.

Image Credit: ShutterStock/Tsareva.pro
Cannabis matrix is also very challenging and it causes matrix interference and ion suppression for a number of pesticides. We also needed to determine what sample provision method should be for different cannabis matrices, such as flower, concentrates, and edibles, in order to achieve high throughput.
How is the analysis of pesticides in cannabis samples regulated?
As there is no federal guidance for the analysis of pesticides in cannabis samples, different states in the US have developed their own testing guidelines. Oregon was the first state in the US to come up with comprehensive guidelines for 59 pesticide residues in cannabis products.
Since the publication of Oregon’s regulations, the state of California has issued the most stringent action limits among all the states in the US for 66 specified residues in cannabis. They included PCNB on their list, which were not on the Oregon list. These pesticides were normally analyzed by GC/MS/MS only in the past.

Image Credit: ShutterStock/Bram Reusen
The California action limits are lower than the Oregon state limits by a factor of 2 to 20. Therefore, due to the more stringent regulations and more pesticides on the California list in comparison to the Oregon list, it is much more difficult to develop a method that can meet Californian regulations for pesticide analysis in cannabis.
How can these challenges be overcome with the LC/MS/MS method with dual ESI and APCI source?
The question we ask is why LC/MS/MS is used instead of GC/MS/MS and LC/MS/MS for pesticide analysis? It is well-known that GC/M S/MS systems are not immune to a dirty cannabis matrix. This means that they require extensive sample cleanup methods, such as SPE and DSP with dirty cannabis matrix. This can lead to low recovery for some of the pesticides.
A simple solvent extraction to achieve high profit is not possible for pesticide analysis with the GC/MS/MS. GC/MS/MS systems also need much higher maintenance since the injector needs to be replaced on a regular basis after 30 to 60 sample injections. Suppose the customers have to do pesticide analysis with LC/MS/MS only. In that case, they need to hire one scientist, buy one piece of capital equipment, and buy one set of consumables instead of hiring two scientists and buying two pieces of very expensive capital equipment and two sets of consumables with the LC/MS/MS and GC/MS/MS methods.
What pesticides are analyzed and how does this analysis take place?
We analyzed all the 66 pesticides on the California list using our LC/MS/MS system with the dual ESI and APCI ion source. When you are developing this method, you need to optimize parameters to get a good signal for difficult analytes. Two of the challenging analytes we measure with the ESI source are abamectin and captan.
We are analyzing captan using an electrospray ion source. Normally captan is measured using GC/MS/MS systems with the EI source. This slide demonstrates that our LC/MS/MS method with ESI source can easily meet Californian actual limits of 700-ppb for captan in cannabis flowers. Abamectin is another pesticide, which has a very low ionization deficiency, and it is sensitive to heat in the source. Its signal goes down as the temperature increases.
 Image Credit: ShutterStock/TayHamPhotography
The majority of the other pesticide’s signal increases with the temperature due to the better desolvation electrospray ion source. Therefore, we had to make a compromise in our source conditions to increase the signal for abamectin by reducing source temperature. We can easily meet California action limits of 100-ppb because our LOQ for this compound is 25-ppb in cannabis flower.
What analytes are being measured?
We are measuring these four challenging analytes; namely pentachloronitrobenzene, chlorophentide chlordane, and methyl parathion with APCI ion source. This slide shows the structure of two of the four compounds we are measuring with APCI ion source. The two compounds are chlordane and PCNB. Their structure shows that they are highly non-polar and chlorinated. They were traditionally analyzed by GC/MS/MS with EI source.
What were the challenges with developing this method?
When we were developing this method in 2017, there was no literature data on LC/MS/MS analysis of this molecule at the time.
When we were thinking of developing this LC/MS/MS method for these molecules, the existing publications claimed that the LC/MS/MS method is almost impossible for these analytes. We always believe that the impossible still means possible. We can develop an LC/MS/MS method for these analytes. We get good signal-to-noise for the four analytes at the California action limits of 100-ppb in the cannabis flower.
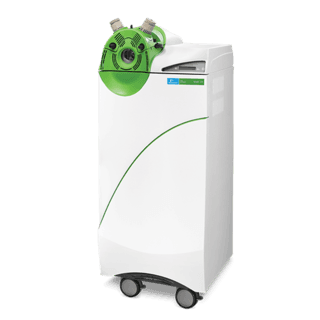
Image Credit: PerkinElmer
Our method LOQ is in the range of 10 to 50-ppb, and therefore we can easily meet California action limits of 100-ppb for these compounds using our novel LC/MS/MS method with APCI ion source.
How does this method align with FBA method validation guidelines for methods to be selective?
Not only is our method sensitive, but it is selective. According to FBA method validation guidelines for a method to be selective, matrix blanks should not have any matrix interference peaks at the retention time of the analyte. This slide shows that the analysis of PCNB in a cannabis flower, even at a low level of 10-ppb, is very selective.
As PCNB background is quite low, it has no matrix interference peak, and we get excellent signal noise, even at a low level of 10-ppb for PCNB in the cannabis flower matrix. The matrix match calibration curve for PCNB in cannabis flower shows excellent linearity over 3.5 orders of magnitude with an excellent correlation coefficient of 0.9999.
Could you explain how you addressed the question of ionization mechanism of PCNB with the APCI ion source?
Most compounds form [M-H]- ion in negative ion mode in both electro spray APCI ion source by loss of a hydrogen ion. This molecule does not even have a hydrogen atom if you look at its chemical composition.
In our proposed mechanism of the ionization of this molecule, we believe that the oxygen molecule captures electrons formed in the corona discharge region of APCI ion source to form super oxide reagent ion. This reagent ion reacts with PCNB molecule to ionize it by loss of chlorine and addition of oxygen atom.
How was proof provided for this mechanism?
To provide proof for this mechanism, we checked the mass spectra of PCNB using APCI ion source. So, when we carried out the mathematical calculations, we determined the mono atomic mass of PCNB to be 293 daltons. Whereas, when we check the mass spectra of PCNB, the mono isotropic ion mass is 274 daltons.
Therefore, PCNB is forming an ion by loss of a mass of 19 daltons. This can be explained easily by the loss of a chlorine atom with a mass of 35 daltons, and the addition of oxygen atom with a mass of 16 daltons, since plus 16 and minus 35 gives you an overall loss of 19 daltons. When we compared the isotope profile of PCNB, obtained experimentally with the critical expected isotope profile of PCNB molecule with the full chlorine atom, we see quite a good match. This shows that PCNB loses one chlorine atom while getting ionized in APCI ion source.
What results did you see when changing the mobile phase composition?
So, when we changed our mobile phase composition from one to two, both the super oxide ion and PCNB ion response increased substantially. This showed that the super oxide ion plays a major role in the ionization of PCNB in the APCI ion source. We observed that the cannabis matrix is quite challenging for pesticide detection since it contains a large number of compounds, such as cannabinoids in a high percentage range and terpenes in a high PPM range, which can cause matrix interference for pesticides present and PPB range.
What is matrix interference and what is it caused by?
Matrix interference means that the matrix blank shows a false signal for pesticides when they are not present in cannabis samples. To explain matrix interference further, we would like to explain the basic theory of LC/MS/MS systems. After you inject your sample with pesticides into an LC/MS/MS system, the LC column will separate the matrix compounds and the pesticides in time. As these molecules enter MS, they will get ionized in electro spray or APCI ion source.
 Image Credit: ShutterStock/scottschoots
In the first vacuum region of MS, it would isolate the parent ion of pesticides at the fixed mass. This ion will undergo fragmentation in collagen cells to form a unique product ion. This means that in the last vacuum region of MS, it will isolate one unique product ion and measure it. Matrix interference is caused by a matrix compound, which has the same retention time on the LC column, parent ion, and product ion as your pesticide.
What pesticides have significant matrix interference?
Acetonitrile is one of the pesticides on the California list, which can form both protonated multi-ion and ammonium adducts in an electrospray ion source. So, if we use the protonated multi-ion for acetonitrile as a parent ion, you can see that we cannot meet the California action limits of 100-ppb for this compound in cannabis matrix due to the matrix interference. We might be able to meet the higher Oregon state action limits of 2000-ppb, but we cannot meet the lower California state action limits of 100-ppb, due to the matrix interference for this compound using this MRM transition.
If we use ammonium adduct as a parent ion for acetonitrile, then we can easily meet California action limits of 100-ppb, because now the matrix interference is minimized by changing our MRM transition.
Spiromesifen is another pesticide that has a lot of metric matrix interference with cannabis flower. So, if we use MRM transitions, which have the best signal in the solvent matrix, then we see a lot of metric interference with the cannabis flower and we cannot meet the LOQ of 10-ppb in the cannabis matrix for this compound. For spiromesifen, not only did we have to determine MRM transitions with minimal matrix interference, but we also had to optimize our LC gradients to get LOQ of 10-ppb for both quantifier and qualifier ion for this compound.
How do you determine what your sample preparation method should be for the extraction of pesticides from the cannabis flower matrix to achieve high throughput?
We could have used any of a range of techniques to carry out sample preparation, but we believe that in comparison to the three techniques; namely QuEChERS, BSP, and SPE; solvent extraction is much faster, simpler, cheaper, and shows good recovery for all the compounds. Therefore, solvent extraction is the most suitable method to achieve high throughput in cannabis production labs.
How is sample preparation recovery defined?
This is calculated by taking the ratio of the signal in a pre-spike extract to the signal in post-spike extract, and times it by 100. There are excellent recoveries for pesticides using acetonitrile solvent extraction in the range of 80 to 120%, with an RSD of less than 20%. We are getting very good recovery for all 66 pesticides, in the range of 80 120%, using our solvent extraction method.
For comparison, if you use QuEChERS, then the recovery of benzamide is less than 10% since its optimal water parchment coefficient is minus 1.5. Therefore it stays in the water phase during the salting-out step with QuEChERS. If you use dispersive SPE or SPE, then the recoveries for a few analytes, such as spinosad and others, are lower than the ideal evaluated percent because some of the patient sites tend to absorb the solvent, such as PSA.
Does cannabis matrix have any other effect on pesticides other than matrix interference?
Apart from matrix interference, cannabis matrix also causes ion suppression for most pesticides. In some rare cases, it also causes ion enhancement or signal enhancement. Ion enhancement means the signal in the cannabis sample is greater than the signal in the solvent standard by 20% or more. Ion suppression means that the signal in the sample is less than the signal in the clean solvent by 20% or more. Cannabis matrix causes ion suppression for most of the analytes.
Please could you define overall recovery?
Overall recovery depends on both the recovery of the sample preparation and the ion suppression effects. So, the first ratio term in this formula for overall recovery represents the recovery of the sample preparation, while the second ratio term counts for the ion suppression effects.
Ion suppression effects can be reduced by more dilution, but it will also reduce the sensitivity of your analysis.
We will use the example of early eluting carbofuran and a late eluting acetonitrile in solvent and cannabis flower matrix with different overall dilution ratio. For carbofuran, ion suppression effects can be eliminated using 10X dilution. In contrast, ion suppression effects for acetonitrile can be reduced only at a higher dilution factor of 100X. With 100X dilution, the sensitivity of the method goes down. Therefore, we are using a 10X dilution as a compromise between 5X and 100X dilution to reduce ion suppression without reducing sensitivity for the early eluting analytes.
Can a universal matrix be determined?
Cannabis product comes in three main forms, namely, plant, concentrates, and edible products. Ion suppression effects are different in different cannabis products. The matrix effects are even different in different types of distillate and strains of plant material. This means that it is very difficult to determine a universal matrix that can represent all the cannabis matrices to carry out matrix match calibration for the quantification of pesticides in different cannabis samples.
Image Credit: ShutterStock/420MediaCo
Another practical approach would be to use a neat solvent standard-based universal calibration technique for the quantitation of pesticides in different cannabis matrices. If you use the solvent standard-based calibration, then the overall recovery of pesticides, such as acetonitrile, would be low, due to the ion suppression.
Overall recovery for acetonitrile is 33% due to the ion suppression effects. We would like to mention again that the sample preparation recovery is still about 90% for this compound from the cannabis flower matrix, but our overall recovery is low, at the level of 33%, due to the ion suppression effects.
How can a solvent standard-based calibration improve the overall recovery?
If you are using a solvent standard-based calibration, then the overall recovery can be improved by using internal standards to compensate for the ion suppression effects of the analyte signal in the cannabis matrix. For instance, if we are looking at adding a fixed amount of deteriorated analog of analyte to both solvent standard and your cannabis sample. Since the internal standard has a chemical structure similar to the analyte, its elution and ionization suppression effects would therefore be the same as the analyte in both the solvent standard and the sample matrix.
Image Credit: ShutterStock/New Africa
Now, when you take the response ratio of the analyte to an internal standard, it would be the same in both the solvent standard and your cannabis sample. We are now able to improve the recovery for acetonitrile from a low value of 33% to 87% by adding internal standards to our method. We can improve the overall recovery for all the pesticides on the California list by adding internal standards to our method.
Since cannabis matrix is quite hydrophobic, most ion suppress effects are observed for late eluting analytes. Therefore, the overall recovery goes down for analytes with the increase in retention time and no internal standard. With the addition of internal standards, we were able to improve overall recovery from a low value of 30 to 70% to an acceptable range of 80 to 120% by compensating for ion suppression effects.
What is proficiency testing, and how can it be used to check method accuracy?
Proficiency testing is an inter-laboratory test. Different labs which participate in this test are given a blank hemp matrix sample and an unknown spiked hemp sample with unknown amounts of pesticides. Each lab needs to determine the number of pesticides in this unknown sample with their method.
This test helps evaluate the performance of their method with their peers. If you pass the test, it assures good quality of analysis to your customers. This could get you closer to getting certification at your lab. If you pass the test partially for a few analytes, or you do not pass the test at all, it gives you an option to assess and improve the performance of your method.
What are Z scores, and how are they calculated?
In your proficiency test report, the Z scores are very important, and they are calculated by dividing the absolute difference between your lab results for the analyte and the mean of all the data by the standard division of all the data.
If you get Z scores of less than two, your results are satisfactory. And that means you pass the test. If your Z scores are given a three, that means your scores are not acceptable, you did not pass the test, and you need to improve your method. If the Z scores are between two and three, it means that your results are questionable, and you only just pass the test.
 Image Credit: ShutterStock/HQuality
We participated in the Emerald scientific proficiency test for 66 pesticides regulated by California state in hemp. We got our test report back, and we are pleased to inform you that our method passed the test was flying colors since all the Z codes were less than two. We did not report any false positives or false negatives. If you look at the Z score distribution on this slide, about 92% of the Z scores were less than one. This shows our method is quite accurate for the quantitation of 66 pesticides in a hemp matrix.
What are the detection limits with the LX/MS/MS method, and how do they align with Californian action limits?
Our novel method allows us to analyze the limits using LC/MS/MS only. We can easily meet the California action limits for 66 pesticides with one instrument. Now our customer only needs one instrument, one set of consumables, and one scientist to reduce the cost of their analysis. A number of pesticides; namely Pentachloronitrobenzene, permethrin, parathion, pyrethrin, naled, are normally analyzed with GC/MS/MS, but with our LC/MS/MS method, we get excellent detection limits, and we can meet California action limits for these compounds.
Our method LOQ has been used for the pesticides on the California list in the cannabis matrix. This is the case for a number of such pesticides; namely chlordane, chlorosentil, chlorofenvinphos, nickel parathion. We get excellent detection limits using our LC/MS/MS method and we can meet California action limits for these compounds easily using LC/MS/MS. We do not require our customers to use GC/MS/MS for these analytes.
Could you please provide a summary of your work for the reader?
We developed the novel LC/MS/MS method with dual APCI and ESI ion source, which can meet California state requirements for 66 pesticides in cannabis and hemp matrix. In our method, 62 pesticides were analyzed using an electro spray ion source, and rest of the four pesticides were analyzed with APCI ion source. We elucidated the mechanism of PCNB ionization with APCI ion source and showed that the PCNB response is selective, sensitive, and linear.
Matrix interference was minimized by optimizing our MS and LC methods. We strongly believe that solvent extraction is the most cost-effective, sample proficient method to achieve high throughput in cannabis testing labs.
We added a number of internal standards in our method to compensate for ion suppression effects to get an overall recovery in the range of 80 to 120%. Our method passed the Emerald scientific proficiency test for the analysis of 66 pesticides in hemp with flying colors.
About PerkinElmer Cannabis & Hemp Testing Solutions
 With the cannabis and hemp markets continuing to grow rapidly and regulations strengthening, labs increasingly need streamlined access to best-in-class testing solutions geared toward the unique requirements of the industry. Whether your lab is well established or just starting up, PerkinElmer is a single-source vendor for instruments, methods, reagents, and consumables on hand to help enhance your testing capacity and get ahead of the competition.
They help drive analytical best practices and operating procedures and commit to ensuring your laboratory has maximum uptime. Learn about their various instruments, testing methods, and applications for cannabis analyses. Let them work with you to build an efficient workflow, so you can focus on growing your business.