In this interview, PerkinElmer, talks to AZoLifeSciences about the types of elution methods for cannabis analysis.
What are the types of elution methods?
There are two main types of elution; isocratic or gradient.
The advantages of isocratic elution are that it is simple: you are not changing anything. However, the longer your analysis, the broader your peaks are going to get. Inherently, what happens is LC: because you’re not changing the flow rate or anything, the longer your analytes are retained, the more they start to disperse.
Now, gradient elution can push them back together by changing the mobile phase composition. Since you are not using an isocratic method, you are going to end up with broader peaks. That is the main disadvantage of isocratic elution.
However, there is also more versatility and a bit more inclusivity using the gradient method: giving you a wider range of analytes that you can analyze in one run. However, on every single run, you have to re-equilibrate to the initial mobile phase flow rate, concentration, and so on every single time. The more intense your gradient, the longer that re-equilibration time can get. That is why we went with an isocratic method.
What are some of the issues with gradients?
In general, gradients can be very useful. However, when you have really small peaks and really small concentrations of those peaks, which is the case for some of these cannabinoids, you can lose a little bit of reproducibility in peak area measurements if that peak is on the incline of that baseline. So the user can see it is very apparent on those small peaks. They might be able to see this a little bit on the higher concentration peak, but it will not really affect it as much.
When it comes to things that are often in high concentration, like your THCs or CBDs, that is not a big issue - but when you have a lot of these other cannabinoids, you are going to want to accurately quantify these, and those can get thrown off a little bit if they are at really small concentrations.
 Image Credit: ShutterStock/Tinnakorn Jorruang
Now, when compared to our current isocratic method, the results will produce a nice flat baseline with nice baseline separation. This can be achieved with isocratic: even though those peaks are getting a little broader by the end, that can be accounted for with other integration parameters, like bunching factor and stuff.
The other important thing is the order in which the compounds are alluded. Not only can isocratic versus gradient affect your reproducibility, but the mobile phase composition can drastically change, not just the elution times, but the elution order as a result of changing the mobile phase composition.
Why is mobile phase composition important?
We already know that mobile phase composition is important. We know that changing the mobile phase concentration - not just by adding a buffer like ammonium formate - but any changes can help decrease analysis time or afford better separation.
That is what ammonium formate did for us in this case. If you are not careful about consistently making your mobile phase, you can have issues with your chromatography. This is what happened to us: we created this method, we sent it off to customers and we began to notice at certain customer sites that there were fluctuations and retention times or occasional coalition, but it was not consistent.
We thought about this, and eventually, we figured out that it was probably the mobile phase. Even a small change in the concentration of the ammonium formate can affect the resolution. A change of just a couple of milli-molar goes from being able to analyze it and quantify consistently to being unable to quantify that without some manual integration or some sort of manipulation of the data.
This is a crucial element to keep in mind - consistently making your mobile phase and catering it to your specific chromatography needs can be vital in achieving the right separation and allowing you to have that accurate and precise analysis of your data.
In terms of the LC method, can you talk us through the wavelength program versus a single wavelength?
The LC method is the wavelength program versus like a single wavelength. When you compare results obtained by our current method - 16 cannabinoids, all separated by isocratic, gradient – to the results using a wavelength program.
Though it does not change significantly, there are several points where we are going from 228 to 265, to 255, and to 220. When you compare that directly to the same exact sample, because we are using a PDA, we are collecting all of the wavelengths at once. We are, therefore, able to actually pull different wavelengths with the exact same data. There are a couple of compounds that greatly improve in sensitivity, or at least improve a little in sensitivity - if you choose the ideal or the optimum wavelength for that compound.
Single wavelength is often the way to go. It is just a lot simpler, but if you have the time and the money to develop a wavelength program, you can achieve some incredible sensitivity even in a single run, just switching back and forth between different wavelengths.
Could you summarize the factors that are important when it comes to optimizing your methodology?
While you can go about developing your own method, keeping the things we have mentioned in mind, there are other factors that will come into play to fully optimize your methodology. Alternatively, you could use our method that we have spent more than a year developing with a simple HPLC PDA system; you can monitor up to 16 cannabinoids in under eight minutes.
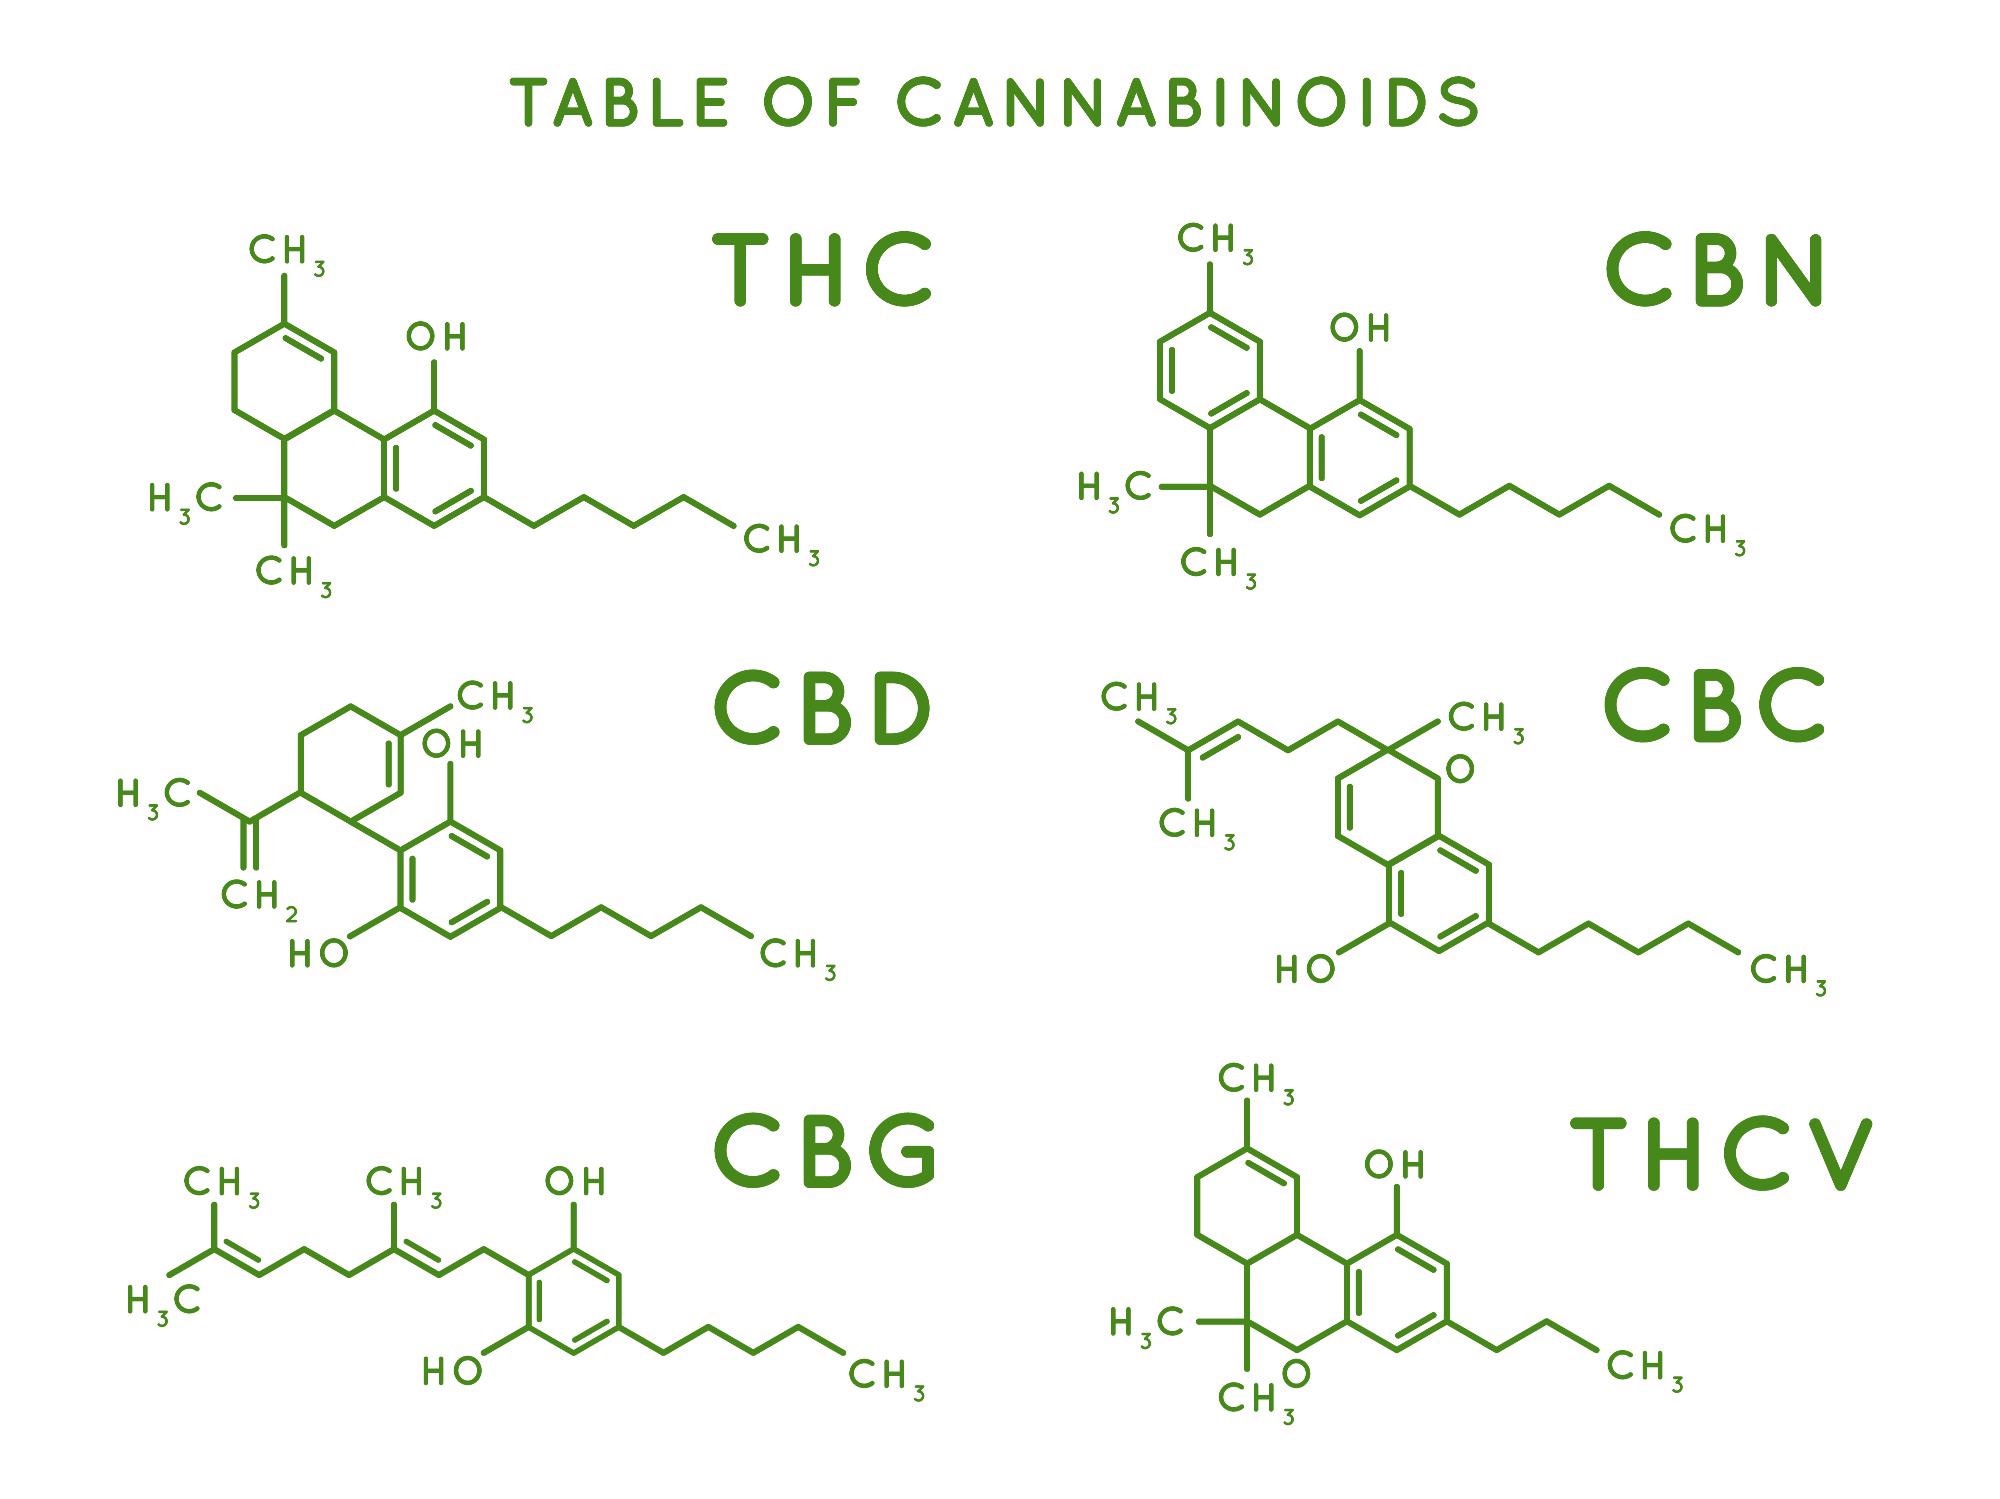 Image Credit: ShutterStock/Tartila
It’s about eight and a half minutes in total from injection to injection, which is very short and the user is getting all 16 cannabinoids fully base length separated. This can be done using a single wavelength, as mentioned, or multi-wavelength for the most sensitive analysis. In the case of all these analytes, the linearity is fantastic: 0.999 across the board and actually nearly 0.9999 for all of the analytes.
There is, therefore, excellent linearity across the board, and the analytical range that can be monitored is as low as 0.045% - up to about 7.5% for most of the analytes. That usually suffices because most of them do not go above a couple of percent. However, as we mentioned earlier, there are some newer hybrid strains that have high THCA or CBDA, and we have accounted for that already in our method by having a little bit extra of a higher caliber for those two analytes specifically.
We can analyze them up to about 30 to 40% by weight. Beyond that, if you were to further dilute the sample beyond our current parameters, you can actually keep increasing that percentage. There are some oils and extracts with customers that we have worked with who were up to 80 or 90% CBD or some other compound.
 Image Credit: ShutterStock/r.classen
We are also able to push those into the range by changing just the dilution factor by changing the sample prep, so there is a lot of flexibility with the method to achieve the results for your specific analytes, but we have already done a lot of that work.
Lastly, the recoveries all look great between 90 and 110 or so percent with very minimal relative standard deviation at the lowest levels. If we jump up to a more mid-typical level, we’re at 96 to a 107%: we even did a high recovery study with just the THCA and CBDA at their really high percentage, and we were getting 95% to 105% recoveries.
We, therefore, have a really good method available. In addition to the LC potency method, we have these ready-to-go plugin guidelines for all the different regulations and tests that a lot of states require. This includes pesticides by LCMS, elemental analysis by ICPMS, residual solvents and terpene profiling by GCMS, as well as the LC potency assay so that we can offer a range of solutions to meet your needs.
Why is it so important to convert the THCA to THC in the equation?
As we mentioned before, it is important to take this into account because a lot of the time you are calculating these things as a percent by weight. So just inherently in how it has always been for cannabis and hemp, we are looking at percent THC, percent CBD, whatever it is. In the process of either using -as in smoking and vaping - whatever that flower or oil - or creating an edible or extract, the THCA will convert into THC.
 Image Credit: ShutterStock/Tinnakorn jorruang
The THCA weighs more than the THC. THC is about 87.7% of the weight of THCA. As THC is the most important compound, it’s the defining legality between hemp and cannabis right now. It is also just the one that people often seek out for the psychological effects, so it is important to properly calculate it.
Can you quantify delta-8-THC now?
Delta-9-THC is the primary one. Delta-8 is present often in very small quantities, but it is still there. So while we have mainly discussed the THCA and THC, as THC is so important, delta-9-THC actually has a third molecule that needs to be added to that total D-8. A lot of the time, it is essentially zero, but we can separate it, and we can quantify it if your particular sample or the samples that you happen to be analyzing have a lot of it in it. Essentially, there are no concerns at this point about analyzing it.
What is the difference between HPLC and the new UHPLC?
The difference is mainly in the name. So, they are the same technique: you are not changing how you are doing things essentially, but the system itself needs to be capable of performing the analysis that is happening within the tubing and the column and that.
When you get to really small particle size, there is not an official distinction; but the rule of thumb is two microns. So, if you have a particle within your column that is two micrometers or less, you are probably in the UHPLC range. If it is two micrometers or more, you are considered to be in the HPLC range. You can definitely hit the quote-unquote UHPLC range with bigger particles, but really it all comes down to the pressure on the system.
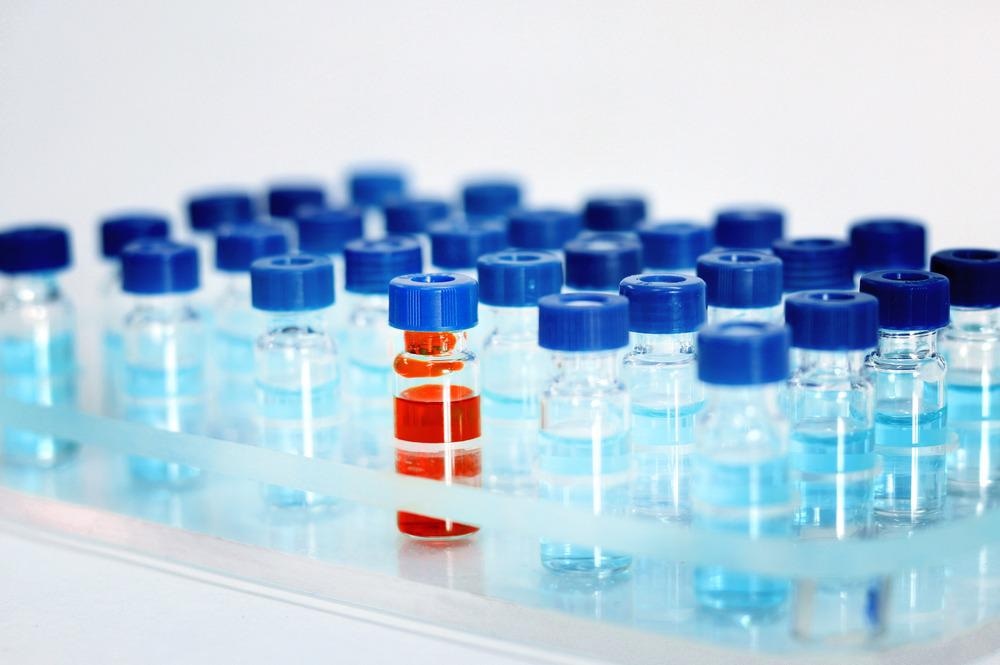 Image Credit: ShutterStock/Endorphin_SK
The smaller those particles, the more pressure that is going to build up when that sample and solvent in your injection hits the column; there is going to be a sudden stop. The column is doing its job. It is stopping everything from just flying through the system. Because of that, you are going to build up some pressure. When you have those really, really small molecules or particles that can be packed so tightly, you are just going to build up a lot of pressure. At some point, the system cannot handle it anymore.
If you have a UHPLC system, you can perform all of HPLC - but if you have an HPLC system, you are stuck at whatever pressure you can go up to. If your column happens to build up enough pressure that your system cannot handle it anymore, that is when you would need to jump up to that nexus. They are both the same technique, but they involve a different instrument because of the necessity of being able to handle what is going on within the chromatography.
Do users need to have prior experience with an HPLC or is a training available, and is that training enough?
Technically speaking, you do not need prior experience to run an HPLC if the vendor you buy from trains you on how to utilize it. Now, something like this, while it is a simpler method, we highly recommend having someone with experience to at least be around directing the lab; directing the science; choosing what methods you are using.
In the end, is isocratic or gradient elution better?
It really depends on what you are running. We would not say one is better than the other, but we have a preference for isocratic because it is simpler. If you can get an isocratic method to separate the analytes the way you need them to, we would use an isocratic method.
With an isocratic method, the user doesn’t have to worry about re-equilibration. The user does not need a quaternary pump and all the extra binary stuff and all the additional elements: you can get away with the most minimal system, and it’s usually simpler to process.
However, gradients can be necessary and very useful. Even if you can get away with an isocratic method, there are times when it might be necessary to switch to a gradient just to improve either the speed or the versatility of that method.
Can you run potency on an LCMS instead of just an LC?
LC is the minimum you need. So, the UV/Vis detector or the PDA, which is the type of UV/Vis detector, can analyze these compounds. What you are really doing is just building a library.
If you wanted a system that could run multiple tests, pesticide side analysis, for instance, and potency - or if you were really into doing multiple applications, depending on the bandwidth of your laboratory and how many samples you were getting – there are myriad applications that LCMS can be used for. It is one of the most common techniques out there.
It could be used for this because it is the LC that is really separating these analytes. And then the UV/Vis portion is really just detecting them. So the mass spec, another detector that is more powerful than UV/Vis could also do the job.
On the SimplicityChrom software, you said there’s a lab management tool. Are you able to track multiple instruments in one place or is it just a really strong history of what that specific instrument running it has done?
If you really wanted to, we believe SimplicityChrom allows control of up to eight instruments on a single computer. Now, of course, that is a lot to keep track of on one computer - and the processing power of that computer is more likely to limit you more than the software.
You can run multiple instruments. If you only have one instrument, the lab management tool is really responsible for setting those user groups and user roles so that you have different tiers to who can access what and who can utilize what, especially in a compliant environment.
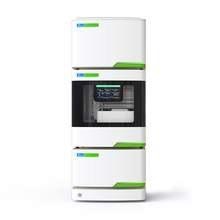
Image Credit: PerkinElmer
You can import and export data. So, if you have a second computer for processing, you can export it from your instrument computer and import it right to the other one super easily with a flash drive or just any of your online storage systems: Dropbox, One Drive, and so on.
As we said, when you set up multiple instruments, you are storing everything in a project. So, if you want to organize different projects, either by application or by month or by year or whatever, you can segregate your data and your different users and stuff by projects. There is a lot going on in that lab management tab that can help really help you keep an eye on everything.
About PerkinElmer Cannabis & Hemp Testing Solutions
 With the cannabis and hemp markets continuing to grow rapidly and regulations strengthening, labs increasingly need streamlined access to best-in-class testing solutions geared toward the unique requirements of the industry. Whether your lab is well established or just starting up, PerkinElmer is a single-source vendor for instruments, methods, reagents, and consumables on hand to help enhance your testing capacity and get ahead of the competition.
They help drive analytical best practices and operating procedures and commit to ensuring your laboratory has maximum uptime. Learn about their various instruments, testing methods, and applications for cannabis analyses. Let them work with you to build an efficient workflow, so you can focus on growing your business.