The majority of potential oncology drugs fail at some stage of the drug development pipeline, despite demonstrating promising in vitro efficacy data. This common phenomenon is driving the development of in vitro models that can better recapitulate tumor biology.
Despite being less physiologically relevant than three-dimensional (3D) culture, two-dimensional (2D) cell culture is still the most widely used method of drug screening. Challenges typically associated with 3D cell models have also hindered its industry-wide adoption as a primary drug discovery screening method, such as assay reproducibility, scalability, and cost.
It is also important to note that the scope of biological readouts from 3D models is generally limited to just a few - or even a single - features that are unable to fully capture the biological complexity of relevant tumoroids.
There has been a growing trend toward using image-based phenotypic profiling in many applications. These approaches, such as the Cell Painting assay, can be used to quantitatively capture a diverse array of phenotypic changes in response to compound-induced or genetic perturbations.
This article highlights the use of a screen using patient-derived 3D spheroids (tumoroids). The researchers employed readouts on cell viability, and adapted the Cell Painting assay to accommodate the 3D tumor model.
Tumoroids were initially formed from primary cells that had been isolated from a patient-derived tumor explant, TU-BcX-4IC. This explant represented metaplastic breast cancer with a triple-negative breast cancer subtype.
The tumoroids were treated with 168 compounds from the NIH library of approved oncology drugs, with Cell Painting then leveraged in the evaluation of any associated phenotypic changes.
To enable a proper comparison with other methods, a single-feature readout from an image-based viability assay was performed in parallel. Based on the phenotypic distance score calculated from the principal component analysis (PCA), 24 hits were identified.
Two-thirds of these 24 hits overlapped with those from the image-based viability assay. When evaluated side-by-side, these results clearly show Cell Painting’s potential as an additional and highly beneficial approach for 3D cell model analysis.
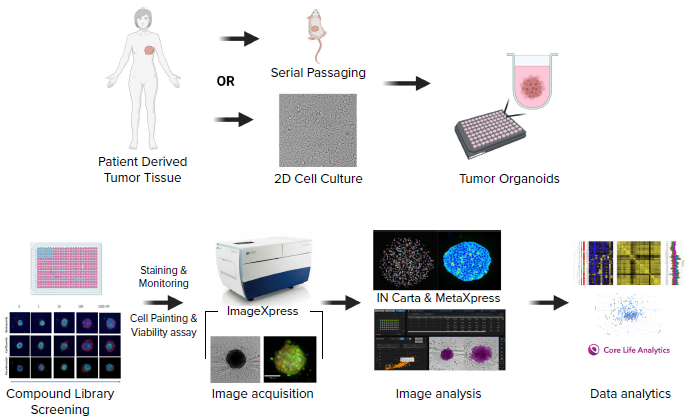
Schematic diagram of the experimental workflow including generation of a patient-derived cell line, formation of tumoroids in 384 well U-shape, low attachment plates, compound treatment, staining, imaging, and analysis. Image Credit: Molecular Devices UK Ltd
Methods
Cell Culture
Approaches for the generation of tumoroids and PDX organoids (PDXO) have been described by Matossian, et al. (2021). In the example presented here, the primary tumor sample was implanted into SCID/Beige mice, exhibiting rapid tumor growth. It took 14 days to reach maximal tumor volume of >1000 mm3.
Once this volume had been reached, the sample was used to generate the cell line before being expanded in 2D culture. Tumoroids were formed from 4IC cells that were expanded in 2D.
Next, 4IC cells were dispensed at a rate of approximately 2,000 cells per well in U-shape low attachment 384 plates (Corning) prior to 48 hours of incubation. This resulted in the formation of tight tumoroids.
The 4IC cells were then cultured using Advanced DMEM supplemented with glucose, NEAA, 2 mM glutamine, and insulin 120 μg/L, 10 % FBS (Gibco 12491-015). In the case of metabolic assays, tumoroids had been cultured with DMEM + 10 % dialyzed serum (2 mM glutamine, 5 mM glucose, without phenol red).
Spheroid Monitoring and Imaging
Acquisition of transmitted light (TL) of fluorescent images was completed using the ImageXpress® Confocal HT.ai High-Content Imaging System from Molecular Devices. This was performed using the MetaXpress® High-Content Image Analysis Software.
Tumoroid images were captured in TL by using an approximately 60 µm offset. During this process, Z-stack images were acquired using the 10x or 20x objectives using confocal mode. Analysis was performed using either the MetaXpress or IN Carta® Image Analysis Software.
Cell Painting Assay and Data Analysis
The 3D TU-BcX-4IC tumoroids were labeled using a protocol modified from Bray et al. for the Cell Painting assay 17–20.
Tumoroids were incubated using MitoTrackerDeepRed (500 nM) (cat #) for two hours, and samples were fixed with 4 % PFA in HBSS for a total of 60 minutes.
Wash steps were performed by exchanging 50 % of the volume in each well with HBSS to minimize displacement of the tumoroids from the well’s center.
After fixation, samples were washed three times using HBSS. To ensure sufficient permeabilization, samples were washed with HBSS and incubated with 0.1 % Triton X-100 (in HBSS) for a two-hour period at room temperature.
Dyes were prepared in HBSS and 1 % BSA (wt/vol) before being incubated overnight with the following ultimate concentration:
- Hoechst (15 μg/ml)
- ConcanavalinA-488 (250 μg/ml)
- Syto14 (7.5 μM)
- Phalloidin750 (15 μl/ml)
- WGA (3.75 μg/ml).
Results
Spheroid Culture and Imaging
The three-dimensional cancer culture was started from the primary triple-negative tumor described earlier. The cell line was adopted for 2D cell culture after it had been developed by passaging primary tissues in SCID mice.
The formation of tumoroids was achieved by culturing 2,000 cells in 384 well-low-attachment plates for 48 hours. Tumoroids were then treated with a range of compounds from the National Cancer Institute (NCI) library of approved anti-cancer drugs. Figure 1 shows the five different concentrations used for testing.
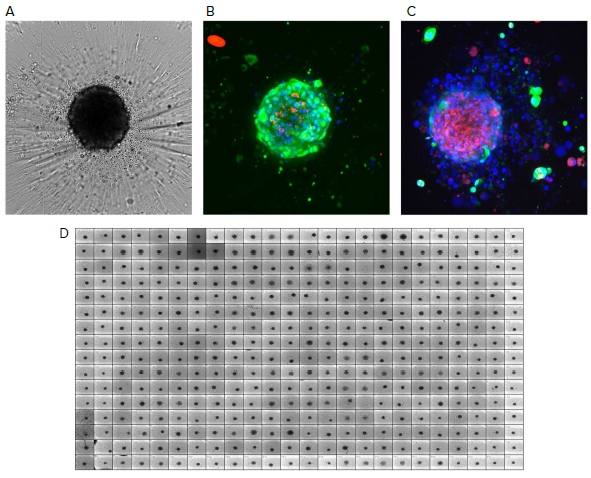
Figure 1. Reference images of tumoroids. A) Tumoroids formed 48h after plating, TL images (10X); B) Composite fluorescent images of untreated tumoroid stained with calcein AM (green), EthD-1 (red) and Hoechst (blue); C) Tumoroids treated with romidepsin (10 nM). Tumoroids were imaged using confocal option of the automated imaging system, Z-stack of 15 images was taken 10 μm apart, then maximum projection images were created (shown). D) 384 well plate with tumoroids after compound treatment, TL images. Image Credit: Molecular Devices UK Ltd
High-Content Imaging and Analysis of Cancer Spheroids
Tumoroids were treated with compounds at five different concentrations (Figure 2) prior to screening based on cell viability. Phenotypic readouts, including tumoroid area, total cell count, and fluorescent intensity, were also quantified.
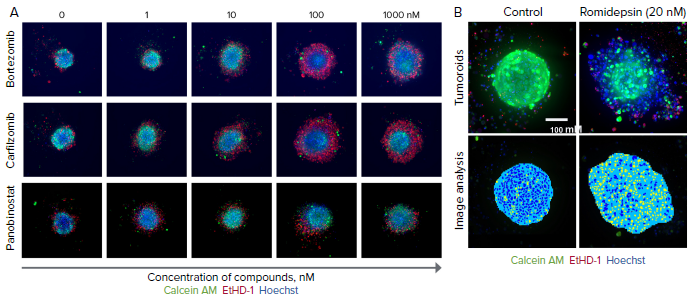
Figure 2. Tumoroids were treated with compounds for 5 days then stained with calcein AM (green), EthD-1 (red), and Hoechst (blue). A) Selected confocal images, 10X shown. Note dose-dependent dis-integration of tumoroids, increase in cell death indicated as increase of EthD-1 staining (in red). B) End-point analysis of fluorescent images was done using Custom Module Editor in MetaXpress. Images of the nuclei of treated and untreated tumoroid shown. Analysis masks show tumoroids projection in blue and nuclei in yellow. Tumoroid area and count nuclei were used as main read-outs for phenotypic characterization of tumoroids and compound effects. Image Credit: Molecular Devices UK Ltd
Deep Learning-Based Segmentation for Label-Free Image Analysis
Image analysis routines can be altered to achieve excellent detection of objects of interest (Figure 3) when using the IN Carta software. The software’s deep-learning semantic segmentation module (SINAP) can also help improve the detection of challenging features.
In the example presented here, a new model was developed to segment images of cancer spheroids that had been acquired in transmitted light. This made it possible to derive more than 200 features (from all seven imaging channels) from the spheroid segmentation mask.
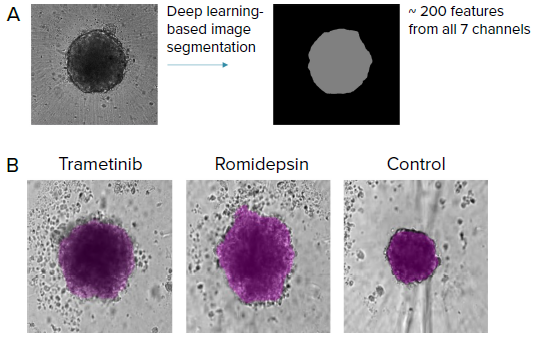
Figure 3. Automated image analysis of tumoroids was done using transmitted light images (label-free) (10X) with AI-based image analysis IN Carta software. A) SINAP (IN Carta) was used to develop a model to segment tumoroids. Over 200 features were then extracted from the segmentation mask from all 7 imaging channels (cell painting) that include stains for mitochondria, nuclei, ER, golgi, actin, RNAP and nucleoli. B) Examples of label-free images from tumoroids treated with different compounds and the corresponding segmentation mask (purple) from SINAP shown. Note that the SINAP model can identify tumoroids that are phenotypically different. Image Credit: Molecular Devices UK Ltd
Results
Cell Painting in Phenotypic Analysis of 3D Spheroids
Various other analysis techniques were performed in parallel to fully characterize phenotypic changes detected. This enabled a more in-depth investigation into cytotoxic mechanisms elicited by the compounds assayed.
The Cell Painting assay was adapted for 3D tumoroids to accommodate the evaluation of compound effects on tumor phenotype (Figure 4).
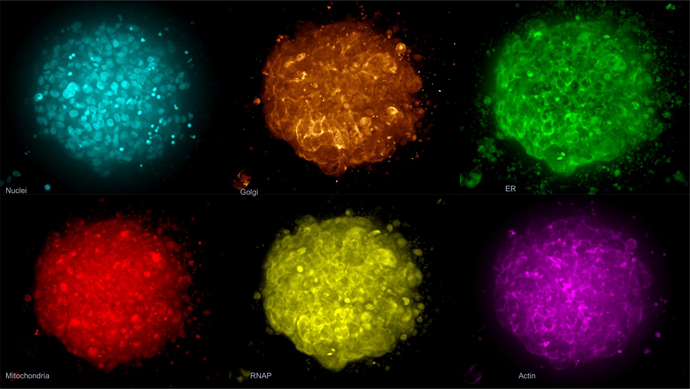
Figure 4. The Cell Painting assay modified for 3D spheroids. Spheroids were labeled with phalloidin, MitoTracker, WGA, SYTO 14, concanavalin A and Hoechst 33342. Shown here is an example image of a control spheroid (maximum projection). Image Credit: Molecular Devices UK Ltd
Data Analysis Workflow
Measurements from the IN Carta software were uploaded into HC StratoMineR to facilitate additional data analysis. This web-based platform can guide users through a common workflow to analyze high-content multi-parametric data effectively (Figure 5).
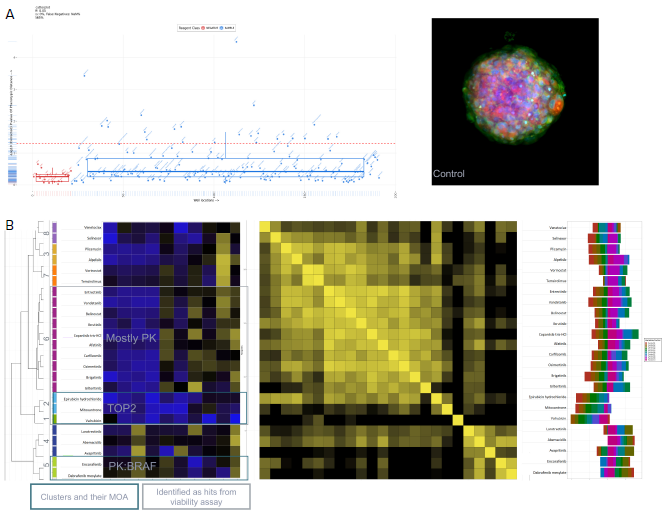
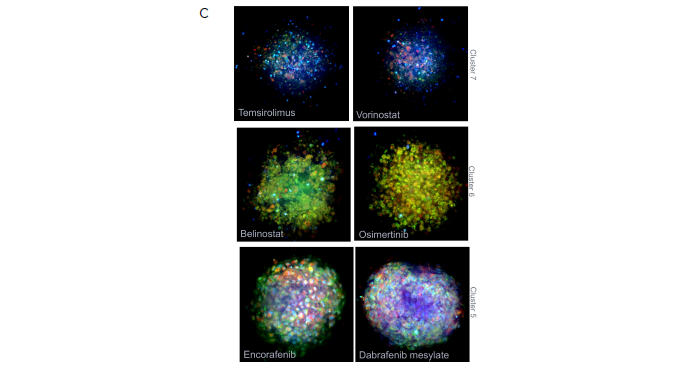
Figure 5. Using StratoMineR for data analysis. A) Scatterplot representing the phenotypic distance score (-log, Y-axis) for each compound is shown. Compound treated samples (blue) compared to negative controls (red) are shown. Hits are identified as those above the red dotted line (p≤ 0.05). B) Results from the cluster analysis are represented as a hierarchical dendrogram. Left: The cluster ID and colored bars indicate which cluster a compound treated spheroid belongs to. Rows represent the included factors and columns represent the compound treatment. Middle: Correlation matrix is shown to give an overview of the similarity/ dissimilarity between the compounds. Columns and rows represent compounds used. The intensity of the color represents the similarity based on the calculated cosine vector score from the PCA factors. Right: Bar graph showing the contribution of each PCA factor to each compound hit. C) Example images grouped by cluster from the Cell Painting assay. Three of the stains, Hoechst (blue, nuclei), SYTO 14 (green, RNAP) and MitoTracker (red, mitochondria) are represented as a composite image. An example of a control DMSOtreated spheroid and spheroids from cluster 7, 6 and 5 are shown. Image Credit: Molecular Devices UK Ltd
Conclusion
The results presented here successfully demonstrate the Cell Painting assays’ feasibility for use on 3D cell models such as patient-derived tumoroids.
In the examples shown in this article, phenotypic profiling at the spheroid level was shown to be sufficient to identify compounds with cytotoxic and non-cytotoxic effects.
Acknowledgments
Produced from materials originally authored by Angeline Lim, Prathyushakrishna Macha, and Oksana Sirenko from Molecular Devices LLC; Evan F Cromwell from Protein Fluidics, Co; Margarite D Matossian, Courtney K Brock, and Matthew E Burow from Tulane University; and Victor Wong, David Egan, and Wienand Omta from CoreLife Analytics.
About Molecular Devices UK Ltd
Molecular Devices is one of the world’s leading providers of high-performance life science technology. We make advanced scientific discovery possible for academia, pharma, and biotech customers with platforms for high-throughput screening, genomic and cellular analysis, colony selection and microplate detection. From cancer to COVID-19, we've contributed to scientific breakthroughs described in over 230,000 peer-reviewed publications.
Over 160,000 of our innovative solutions are incorporated into laboratories worldwide, enabling scientists to improve productivity and effectiveness – ultimately accelerating research and the development of new therapeutics. Molecular Devices is headquartered in Silicon Valley, Calif., with best-in-class teams around the globe. Over 1,000 associates are guided by our diverse leadership team and female president that prioritize a culture of collaboration, engagement, diversity, and inclusion.
To learn more about how Molecular Devices helps fast-track scientific discovery, visit www.moleculardevices.com.
Sponsored Content Policy: AZO Life Sciences publishes articles and related content that may be derived from sources where we have existing commercial relationships, provided such content adds value to the core editorial ethos of News-Medical.Net which is to educate and inform site visitors interested in medical research, science, medical devices and treatments.